Poker Standard Deviation
Poker Stats: VPIP : PFR : Std Dev : The Red Line

Standard deviation ("Std Dev" or sometimes just "SD") is one of those terms you've bumped in to a few times, but you've never fully got to grips to with it. Or, you've heard about it, but it just sounds far too mathsy for you to understand.
So to help you out, I've decided to explain what standard deviation in poker is all about and what it means to you as a poker player. You don't need a background in statistics to enjoy the pleasures of the SD stat, I promise.
What is standard deviation in poker?
Your standard deviation stat gives you an indication of how “swingy” your game is.
- The higher your standard deviation, the higher your variance.
- The lower your standard deviation, the lower your variance.
Standard deviation can also give you an indication of how far you can expect to veer from your current winrate over 100 hands (hence why Std Dev stats are shown in BB/100 ["Big Bets" or "Big Blinds" per 100 hands]).
That's simple enough, but it doesn't give us much to work with. For a better understanding of the poker std dev stat, we'll need to find out what this standard deviation stuff is all about.
An introduction to standard deviation.
Standard deviation is a measure of how spread out numbers are from the average.
To give an example, lets say you go to your local supermarket and measure the width of 5 loose oranges. The widths of these 5 loose oranges are:
- Widths of 5 loose oranges.
- 6cm
- 7cm
- 13cm
- 5cm
- 10cm
- Average width of these 5 oranges = 8.2cm
Now, instead of measuring 5 loose oranges, you decide to measure another 5 oranges from a pack of “medium oranges”. The widths of the 5 oranges from the pack are:
- Widths of 5 "medium" oranges from a packet.
- 7cm
- 8cm
- 9cm
- 8cm
- 9cm
- Average width of these 5 oranges = 8.2cm
You'll notice that the average widths of these two sets of 5 oranges are the same, despite the width of each individual orange in each set being quite different.
- In the first set of loose oranges, the results are varied and spread out.
- In the second set of "medium" oranges, the results are very close together.
Now, because standard deviation is a measure of the spread of results from the average, we can say that:
The standard deviation of the loose oranges is higher than the standard deviation of the "medium" oranges.
I could run through an equation and give you an exact number for the "standard deviation" of each of these two sets of oranges, but I don't want to get too mathsy (and you don't necessarily need to know how to work it out). If you are interested in the equation though, check out this very straightforward article: basic standard deviation example and equation.
This standard deviation video on youtube is also very helpful.
Note: Okay, I can't leave any stone unturned. The SD of the loose oranges is 3.3, and the SD of the "medium" oranges is 0.8. These numbers tell us the average spread.
Standard deviation and poker winrates.
Okay, that's enough about oranges. How does standard deviation in poker work and what does it tell you about your winrate?
Well, instead of measuring oranges, what if you split up your poker career in to 100-hand mini-sessions (or "chunks"), and measured your winrate for each of these sessions?
From a set of results like this, you could work out your mean average winrate (this will give you the average winrate stat that you're used to seeing) and also your standard deviation. The more your winrate varies in each chunk of 100 hands you play, the bigger your standard deviation will be.
Additionally, if you plotted the frequency of the winrates (how often each winrate occurs) over each of these 100 hand chunks in a graph, it would look something like this:
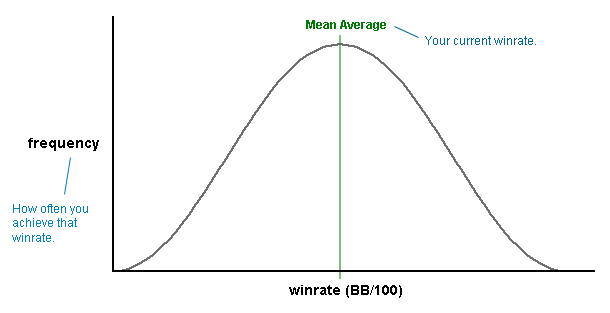
This is called a “bell curve” or a “normal distribution”. There are 2 important things to note about this graph of your winrates:
- Your average winrate is in the very centre of the curve (the peak).
- The further you move from the centre of the curve, the lower the chances of these sort of winrates occurring over 100 hands.
This makes sense, because more often than not your winrate will remain close to your average, but there will be rare occasions where it ends up being quite far from average.
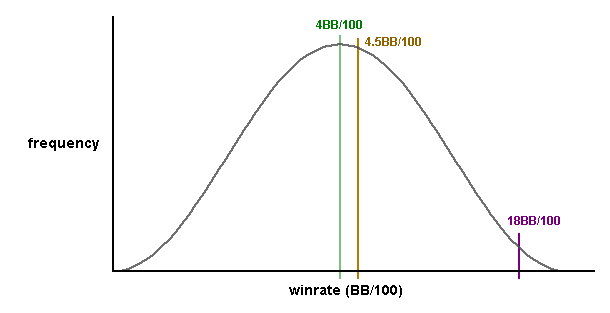
So for example, if you have an average winrate of 4BB/100, achieving a winrate of 4.5BB/100 over 10,000 hands is very likely. However, achieving a winrate of 18BB/100 over 10,000 hands is highly unlikely.
High and low standard deviation graphs.
So, we know that if we plotted a graph of our individual winrates from many small 100-hand sessions it would form a bell curve, with our most frequent winrates collecting around the centre.
But what do high and low standard deviation graphs look like?
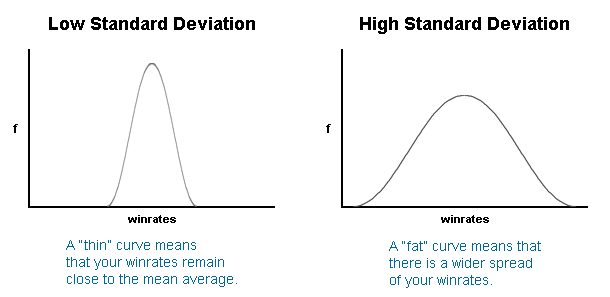
I'm hoping that you can make sense of these graphs by just looking at them. If not though:
- If you have a low standard deviation, your winrates are generally going to remain close to your average winrate over each 100 hand chunk.
- If you have a high standard deviation, you winrates are going to wildly vary over each 100 hand chunk.
The lower your std dev, the thinner the bell curve. The higher your std dev, the fatter it will be to account for the wide variety of winrates.
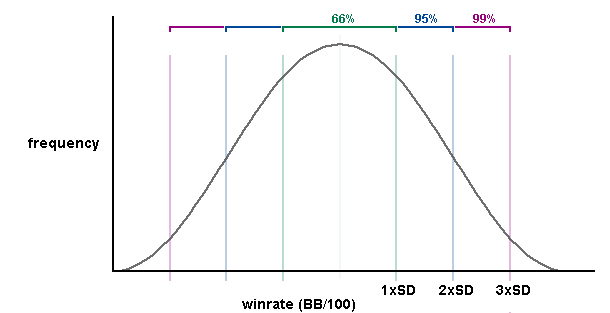
What does standard deviation tell us about our winrate?
Three useful things:
- There is a 68% chance that you will be within 1 SD of your winrate over 100 hands.
- There is a 95% chance that you will be within 2 SDs of your winrate over 100 hands.
- There is a 99% chance that you will be within 3 SDs of your winrate over 100 hands.
Why these percentages? Because this is just how bell curves work. Here's another bell curve graph with some notes to help you understand what's going on.
For more information, here's a short wikipedia article that actually isn't overly complicated: 68-95-99.7 rule wiki.
Using standard deviation example.
Lets say that you're a $50NL player with a winrate of 5BB/100. You also have a std dev of 30BB/100.
Note: In this example we're using poker tracker BBs (Big Bets), which are equal to 2x the size of the big blind (i.e. 1BB at $50NL is equal to $1 instead of $0.50).
68% of the time.
There is a 68% chance that your winrate will fall between 1 standard deviation of your current winrate.
- 1SD = 5BB +/- 30BB
- 1SD = -25BB <=> 35BB
- 1SD = -$25 <=> $35
So there is a 68% chance that you will win (or lose) between -$25 and $35 over the next 100 hands given your current winrate and standard deviation.
95% of the time.
There is a 95% chance that your winrate will fall between 2 standard deviations of your current winrate (2 x 30BB = 60BB).
- 2SD = 5BB +/- 60BB
- 2SD = -55BB <=> 65BB
- 2SD = -$55 <=> $65
99% of the time.
There is a 99% chance that your winrate will fall between 3 standard deviations of your current winrate (3 x 30BB = 90BB).
3SD = 5BB +/- 90BB
3SD = -85BB <=> 95BB
3SD = -$85 <=> $95
What affects your standard deviation stat?
Your playing style.
If you have a LAG (loose-aggressive) playing style you will have a high standard deviation. This makes sense, as you should already know that maniacs and LAGs experience a lot of variance.
On the other hand, if you are a nit that only ever plays premium hands, your standard deviation will be low.
If you're a TAG, you'll be somewhere in the middle.
What's are low and high standard deviations in poker?
The majority of poker players' standard deviations lie between 35BB/100 and 50BB/100 (70bb/100 and 100bb/100).
If your SD is far outside of this bracket, you're probably playing too tight or too loose to achieve an optimum winrate.
Which is better, a high or low SD?
It doesn't matter. Your winrate is the most important thing.
It's like traveling to the next town in a car compared to traveling to the next town on horseback. You get the same destination in the same amount of time, you just take different routes (with one being bumpier than the other).
Most people would prefer the less "swingy" route with a low SD, but don't change your game just because you don't like the look of your SD. Unless your std dev stat is huge and you're due for a myocardial infarction, I wouldn't worry about it.
See how standard deviation affects your results for yourself.
Play with this awesome poker variance simulator.
Keep your winrate the same and enter varying standard deviations and see how the affect your results over different sample sizes.
it just goes to show how you shouldn't worry (or get too cocky) about your winrate over small sample sizes. The differences in the results is surprising.
Poker standard deviation conclusion.
Standard deviation is a measure of how much you are likely to swing up and down during the course of small sample sizes of hands. The higher your SD is, the larger the swings you will face and the longer it will take for your results to converge to your actual win rate.
The higher your Std Dev stat is, the more (and the bigger the) swings you will experience throughout your poker career.
I'm hoping that this big article with all the graphs has helped you to understand standard deviation in poker a little better. It can be a little tricky at first (especially with some of those equations), but it's not so bad when you start to get your head around it.
Here are some more links that I found really helpful:
Go back to the interesting Texas Hold'em Articles.
Can You Afford Not To Use
Poker Tracker 4?
![]()
“I wouldn’t play another session of online poker without it”
“I play $25NL, and in under 1 week PT4 had paid for itself”
Comments